Tiny Happy Features #1 - T4 Template Debugging in Visual Studio 2012:
At some point soon lots of people are going to start writing these epic blog posts about Visual Studio 2012. They will include LOTS of screenshots (some good and some bad), some small code samples and minimal context. I can't speak for other teams; I can only talk about what we worked on. The <AngleBrackets/> folks in Azure Platform and Tools (ASP.NET, IIS, WCF, EF, Azure much and more) have been putting a lot of work into what I sometimes call "Death by a Thousand Tiny Cuts." It's the little irritants that are as frustrating (or more so) as the big missing features.
Rather than a giant super post (although I'll do that at some point, I thought I'd showcase some Tiny Happy Features* that I or another passionate member of the team worked on just because it made life better. Some of these features might not be obvious or easily noticed. Actually it'll be better that you notice the absence of a tiny cut than the inclusion of a new shiny drag and drop toy. It's all part of a larger goal to make the experience of making Web Applications in Visual Studio enjoyable.
I've long said that T4 is one of the best kept "secret" features of Visual Studio. T4 (the Text Template Transformation Toolkit) doesn't have a whole pile of people working on it, but developers like Gareth Jones really care about it and we really like it in the Web team. Lots of our projects use and have used T4 to generate code. In Visual Studio 2012 Gareth worked with Tim Malone so Tim could make a T4 debugger! Be sure to check out the T4 Team Blog.
Sure, T4 fans really want T4 Syntax Highlighting, but in this case, there's already a great T4 SyntaxHighlighting solution or three good options and no FREE debugger.
_5.png)
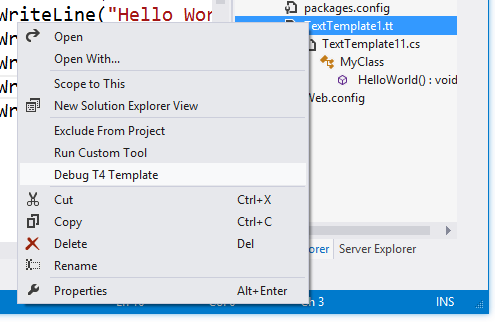
You can now right-click on a T4 templates and Debug T4 template. I've got a breakpoint there on a line within the T4. My own T4 is syntax highlighted with the Tangible Editor.

When I start debugging I can set breakpoints and watches and step through just like any other language.
%20-%20Microsoft%20Visual%20Studio%20(6)_thumb.png)
Notice here in the Immediate Window I'm looking at this.GenerationEnvironment. I can see the generation AS it happens in this variable.
%20-%20Microsoft%20Visual%20Studio%20(8)_thumb.png)
If you like T4 and you want them to know, leave a comment below and I'll use your comments tobludgeon convince management that we should continue to invest.
* Ya, some features aren't Tiny, but some are refinements and I like saying Tiny Happy Features. Sue me.
© 2012 Scott Hanselman. All rights reserved.

DIGITAL JUICE
At some point soon lots of people are going to start writing these epic blog posts about Visual Studio 2012. They will include LOTS of screenshots (some good and some bad), some small code samples and minimal context. I can't speak for other teams; I can only talk about what we worked on. The <AngleBrackets/> folks in Azure Platform and Tools (ASP.NET, IIS, WCF, EF, Azure much and more) have been putting a lot of work into what I sometimes call "Death by a Thousand Tiny Cuts." It's the little irritants that are as frustrating (or more so) as the big missing features.
Rather than a giant super post (although I'll do that at some point, I thought I'd showcase some Tiny Happy Features* that I or another passionate member of the team worked on just because it made life better. Some of these features might not be obvious or easily noticed. Actually it'll be better that you notice the absence of a tiny cut than the inclusion of a new shiny drag and drop toy. It's all part of a larger goal to make the experience of making Web Applications in Visual Studio enjoyable.
T4 Template Debugging
I've long said that T4 is one of the best kept "secret" features of Visual Studio. T4 (the Text Template Transformation Toolkit) doesn't have a whole pile of people working on it, but developers like Gareth Jones really care about it and we really like it in the Web team. Lots of our projects use and have used T4 to generate code. In Visual Studio 2012 Gareth worked with Tim Malone so Tim could make a T4 debugger! Be sure to check out the T4 Team Blog.
Sure, T4 fans really want T4 Syntax Highlighting, but in this case, there's already a great T4 SyntaxHighlighting solution or three good options and no FREE debugger.
_5.png)
You can now right-click on a T4 templates and Debug T4 template. I've got a breakpoint there on a line within the T4. My own T4 is syntax highlighted with the Tangible Editor.

When I start debugging I can set breakpoints and watches and step through just like any other language.
%20-%20Microsoft%20Visual%20Studio%20(6)_thumb.png)
Notice here in the Immediate Window I'm looking at this.GenerationEnvironment. I can see the generation AS it happens in this variable.
%20-%20Microsoft%20Visual%20Studio%20(8)_thumb.png)
If you like T4 and you want them to know, leave a comment below and I'll use your comments to
* Ya, some features aren't Tiny, but some are refinements and I like saying Tiny Happy Features. Sue me.
© 2012 Scott Hanselman. All rights reserved.
DIGITAL JUICE
No comments:
Post a Comment
Thank's!